İlim ve Medeniyet
Yeni Nesil Sosyal Bilimler Platformu
Muhammed Enes USLU
1.Introduction
World trade trade is the movement of goods in which individuals and companies purchase and sell goods and services between countries. In other words, when goods and services move accross the borders in result of purchase, it is called international trade. Especially, international trade is essential part of gross domestic product in the developing countries, which strengthen the economy. (Dinç D. T., Gökmen, A., Nakip, M. & Azari, N.M., 2017)
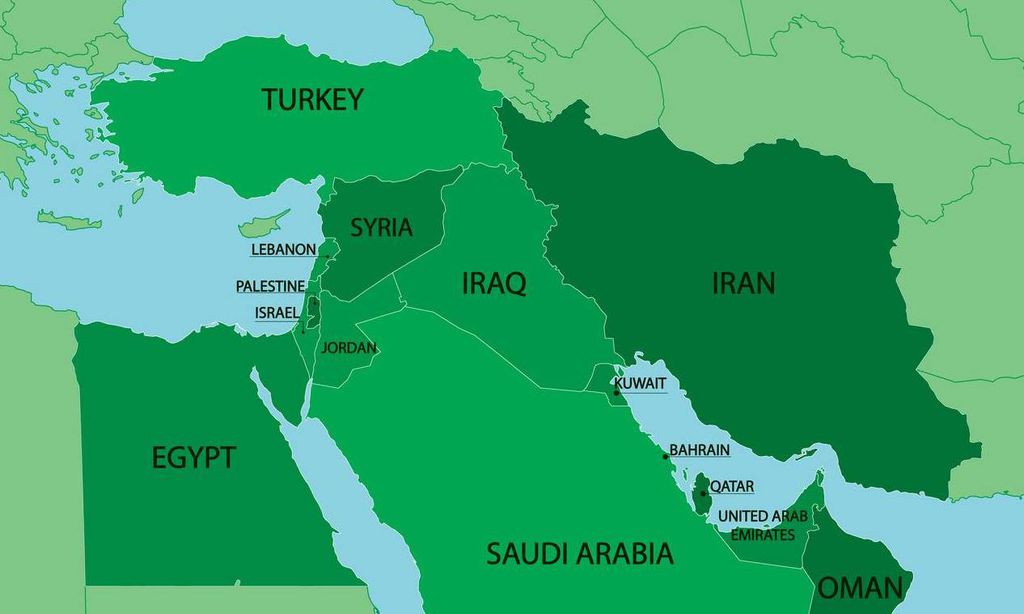
Turkey has an important geographical location because it is located between the Europe, Asia and Africa continents. This helps it to have growth its exportation, business and financial activities should. On the other hand, its location can be seen as dangerous to its trade. because any issue regarding the economic and politcal changes in trade partners affect the trade among these countries. Issues in Middle East an North Africa (MENA) such as Arab Springs in various countries, civil war in Syria, Daesh destruction in Iraq, Qatar Crisis in Gulf Cooperation Council (GCC), Iraqi Kurdistan Referandum and sanctions between Iran and USA had direct effects on the international trade of Turkey. Some of those countries share borders with Turkey and the rest is close geographically and it can be said that MENA has significant volume trade with Turkey in total.
Turkish economy is exporting wide range of products such as medicals, chemicals, food and beverage to MENA and also importing especially oil and gas from countries like Iraq and Qatar.
Therefore, in this paper, the impact of past developments in MENA on international trade between Turkey and those countries will be explored. Export and import mobility and foreign direct investments of MENA in Turkey in the recent years will be analyzed in the research paper. Also, According to Turkish Foreign Ministry (2017), MENA consists of 19 countries which are Bahrain, Palestine, Egypt, Iran, Iraq, Israel, Jordan, Kuwait, Lebanon, Oman, Qatar, Saudi Arabia, Syria, United Arab Emirates, Yemen, Algeria, Morocco, Libya and Tunisian. The paper follows the same definition of MENA region.
2.1. International Trade and Trade Liberalization in Turkey
Hough proposes that countries have been connected via international trade since Ancient times. Especially from 15th and 16th centuries, as global market became more interconnected and more competitive in line with transportation developments and idea of dividing people into discrete categories such as into states, such commercial exchanges clearly be seen as being political as well as economic. (2010).
As Litman (1926) says that there are so many different factors that affect international trade. Therefore, it is highly difficult to quantify the effect of any single case related to trade growth or decline or upon the sources of supply. Thus, the source of how circulation of goods moved from country to country and even continent to continent are not measured dependent on one factors.
According to Foreign Trade Statistics report [1](2017), International trade liberalization and outward opening in Turkey implemented in 1980’s by liberalization process and passed through several phases: Turkey has been member of World Trade Organization (WTO) since 1995, and then signed an agreement with the European Union, enabling it to join the Customs Union in 1996. Turkey also became member of many other various organizations such as Economic Cooperation Organization (ECO), Organization of the Black Sea Economic Cooperation (BSEC) and International Chamber of Commerce (ICC). In addition to the Customs Union with the EU, Turkey has signed Free Trade Agreements (FTA) with more than 20 countries.
2.2. General Overview on Turkey and its Economic relations with MENA
Turkey has effective political and economic relations with MENA, Africa and Europe at the same time. Although economic relations of Turkey with MENA has been improving over the past decades, there are also certain countries that trade volumes with Turkey sharply fell because of many reasons such as political relations between the governments, economic depressions and political and economic instability in the countries. Therefore, a specific analysis is required for some countries such as Saudi Arabia, Qatar, UAE, Tunisia, Libya, Syria, Egypt, Iraq and Iran.
As Köse says by (2014) that Turkey have developed its trade volume rate in total with MENA countries from %7 to %18 while of EU decreased from %48 to %38 since 2002 until 2012. Besides, number of EU countries rose to 27 from 15 between the years 2002 and 2012. Turkey’s export with MENA increased to around 52 billion US dollars in 2012 from 5 billion in 2002.The table 1 shows trade volume of Turkey with MENA and European Union countries below. Thus, MENA has been a rising star for economic partnership to Turkey whereas recent developments after 2012, might pose a threat to this fruitful cooperation. For instance, Özdamar, Halistoprak, Sula shows in their article (2014) that Turkey’s trade with Syria that reached 2.2 billion us dollars fell sharply towards the end of 2011 due to the conflict in Syria and Turkey’s stance against the Syrian government.
Export Volume with MENA and GDP of Turkey
| Export to MENA | Import to MENA | Trade Volume with MENA | Export to EU | Import to EU | Trade Volume with EU | |
| 2002 | $4.706.385 | $3.179.206 | $7.885.591 | $20.457.906,51 | $25.698.220,87 | $46.156.127,38 |
| 2003 | $8.741.208 | $4.399.617 | $13.140.825 | $27.479.359,56 | $35.156.835,64 | $62.636.195,20 |
| 2004 | $10.124.640 | $5.438.715 | $15.563.355 | $36.698.919,11 | $48.130.900,06 | $84.829.819,17 |
| 2005 | $12.728.628 | $7.650.617 | $20.379.245 | $41.532.953,02 | $52.781.362,17 | $94.314.315,18 |
| 2006 | $14.412.416 | $10.317.556 | $24.729.972 | $48.148.628,28 | $59.447.587,00 | $107.596.215,28 |
| 2007 | $19.111.005 | $12.434.494 | $31.545.499 | $60.754.021,95 | $68.472.308,83 | $129.226.330,79 |
| 2008 | $31.280.657 | $16.681.154 | $47.961.811 | $63.719.096,60 | $74.513.444,22 | $138.232.540,82 |
| 2009 | $26.608.583 | $9.371.678 | $35.980.261 | $47.228.119,25 | $56.616.301,80 | $103.844.421,04 |
| 2010 | $30.320.041 | $16.108.919 | $46.428.960 | $52.934.451,88 | $72.391.053,36 | $125.325.505,24 |
| 2011 | $34.635.577 | $23.781.467 | $58.417.044 | $62.589.257,39 | $91.439.406,14 | $154.028.663,53 |
| 2012 | $51.894.757 | $24.718.351 | $76.613.108 | $59.398.377,06 | $87.657.461,58 | $147.055.838,64 |
| 2013 | $45.616.410 | $25.722.530 | $71.338.940 | $63.039.810,45 | $92.457.992,40 | $155.497.802,85 |
| 2014 | $45.141.604 | $23.916.235 | $69.057.839 | $68.514.370,31 | $88.783.650,69 | $157.298.021,01 |
| 2015 | $39.612.882 | $16.581.595 | $56.194.477 | $63.998.493,54 | $78.681.345,94 | $142.679.839,49 |
| 2016 | $39.059.172 | $16.961.545 | $56.020.717 | $68.343.907,76 | $77.501.202,88 | $145.845.110,63 |
Table 1. Source: Calculated values from TUIK (Turkish Statistical Institute) (Note: value by thousands)
2.3 Sanctions Against Iran
Another case in MENA is world’s outlook on Iran and related economic restrictions on it. As to US Department of the Treasury (2017), the United States has been applying economic sanctions on Iran because of Iran’s verified nuclear commitments. Similar actions have been followed by most of the developed and some developing countries.
According to KPMG, the US restricted imports from Iran and applied the first sanctions after the 1979 revolution in Iran. Between 1995 and 1996, US restricted to make trade with and invest in Iran. Besides, it applied sanctions on foreign companies that have more than $200 million trade volume in Iran. Since 2008, the sanctions on Iran have become more stringent. Iran banks have been on the black list in the SWIFT global finance system. Then, USA forbid to import oil from Iran with the exception of 7 countries including Turkey. From 2010 to 2013, Iran’s GDP decreased by %4. (2016). This limits Iran’s global economic activities and harms both Iran and its major trade partners.
Iran is a neighbor country that has historic ties with Turkey. According to TUİK (2017), it is also 11st biggest exporter and 9th biggest importer country to Turkey in 2016, which makes Iran one of the most important trade partners of Turkey in the MENA. Although Turkey has a positive trade balance with Iran, it could have been more than current amounts if the sanctions on Iran did not exist. Iran’s ambassador to Turkey Alireza Bikdeli (2013) claimed in his speech that the embargo against Iran had a negative effect on economic relations with Turkey. Bikdeli also added that Turkey’s trade turnover with Iran has reached 22 billion US dollars in 2012, whereas it could have reached about 30 billion us dollars. (2013). However, his claim about trade turnover numbers cannot be proved scientifically.
2.4. Arab Springs Effects on International Trade and Civil War
“The Arab Spring refers to the stream of events which started in Tunisia, 2010, and then it spread to Egypt, Syria, Libya, Yemen and Bahrain and also impacted most countries of Middle East and North Africa (MENA). There were various social-cultural, political and economic effects which caused the Arab Spring. ” (Öncel and Malik, 2015).
Although it is not easy to access a reliable economic data, negative impact of civil war on economy and the decrease in purchasing power and worsening trade relations needs no proof. Some of MENAcountries recently has witnessed violent uprisings in many countries such as Tunisia, Egypt, Libya, Syria, Yemen and Bahrain, which led to civil wars or regime shifts. Furthermore, terror organisations like Daesh caused civil war in Iraqi Kurdish regional government where Turkey has been importing significant amount of oils and exporting large amount of goods. Şahin and Şahin (2014) show that Arab Springs starting in 2010 played a crucial role in economic decline of the countries, in their GDP, consumption, FDIs and unemployments, which directly influence their economic partners.
Also, Özdamar, Halistoprak, Sula (2014) say that “Turkey is one of the key countries affected by the Arab Uprisings. Until these events, Turkey enjoyed privileged relations and powerful economic linkages with these MENA regimes via cross-border trade, foreign investment and foreign aid. While some of these relationships have changed for the worse.”
Barbiery and Reuveny (2005) claim that openness policies of a country may prevent the possibility of a civil war within a country. They say (2005) that “Opennes to trade, FDI and FPI enables allocation of production factors to their most efficient uses, promoting development, which strengthens the government, providing it with more revenues as the tax base is larger.” Economically stronger states have also stronger police and military, preventing the occurrence of potential rebels. In addition, richer people are less tend to be grievances and to revolt towards governments than poor. Lastly, civil wars causes more opportunity costs to richer countries because income that revolts could earn in the labor force, fighting expenses that could be utilized for growth. Therefore, development in the country with trade promotes peace within the country and prevent rebellions (2005).
Export of Turkey by Countries where Arab Spring spread
| Year | Tunisia | Libya | Egypt | Syria | Bahrain | Yemen |
| 2005 | 294 785 | 384 167 | 687 299 | 551 627 | 41 915 | 197 193 |
| 2006 | 324 893 | 489 261 | 709 353 | 609 417 | 35 303 | 197 869 |
| 2007 | 530 277 | 643 150 | 902 703 | 797 766 | 76 651 | 274 289 |
| 2008 | 778 098 | 1 074 288 | 1 426 450 | 1 115 013 | 308 223 | 353 605 |
| 2009 | 645 767 | 1 795 117 | 2 599 030 | 1 421 637 | 113 628 | 379 263 |
| 2010 | 713 632 | 1 932 370 | 2 250 577 | 1 844 605 | 172 024 | 330 392 |
| 2011 | 802 302 | 747 629 | 2 759 311 | 1 609 861 | 160 418 | 272 733 |
| 2012 | 796 738 | 2 139 440 | 3 679 195 | 497 960 | 208 520 | 485 937 |
| 2013 | 892 157 | 2 753 096 | 3 200 362 | 1 024 473 | 199 065 | 605 214 |
| 2014 | 915 041 | 2 059 898 | 3 297 538 | 1 800 962 | 204 085 | 643 827 |
| 2015 | 819 061 | 1 419 760 | 3 124 876 | 1 522 032 | 225 296 | 395 752 |
| 2016 | 910 613 | 906 107 | 2 732 926 | 1 321 981 | 193 281 | 535 505 |
Table 2. Source: Calculated values from TUIK (Turkish Statistical Institute)
Governance regimes have not changed in only Syria and Bahrein after Arab Springs begun since 2010. Export volume of Turkey to the countries where Arab Spring spread over 2010 can be analysed with data provided by TUIK. (Table 2). There is an upward trend in export volume of Turkey to Tunisia from 2005 to 2012 and the it fall within 2012, but increased again very slowly by 2016. In Libya, it has significantly increased from $384 million to almost $2 billion from 2005 to 2011. A lowest export level between 2008 and 2016 is seen in 2011 with $757 million and then it steadily decreased from 2012 to 2016. In Egypt, again, there has been a considerable growth in export volume of Turkey since 2005 to 2012 and this amount gently decreases by 2016. Despite shift in regime in Egypt after 2011 and political tensions between Turkish government and Egypt administration since 2013, export of Turkey has not declined much. But, it used to increase sharply since 2005. In Syria, similar growth trend is seen between 2005 and 2011 with other Arab countries. What is interesting in Syria case is that export volume of Turkey has sharply decreased only in 2012 and then it has been still fluctuating after 2012 without sharp decrease like that year, although there is a civil war inside the country and also Turkey cut the diplomatic ties with Syria. Bahrain and Yemen are smaller countries compared to the Tunisia, Libya, Egypt and Syria. Fluctuations in export of Turkey are seen in these two countries. In short, Arab springs have led to some certain changes in the administrations of countries. While it was happening, economies of these countries are damaged. Turkey also lost in the export volume to those countries in the same period.
3.International Trade with the MENA Countries
3.1. Turkey’s Import and Export with MENA
According to the TUİK data (2017), top 20 importer partner of Turkey includes 7 countries from MENA, which are Iraq, UAE, Iran, Saudi Arabia, Israel, Egypt and Algeria while only 2 countries that are exporting to Turkey included in the top 20 list in recent years. As seen on table 3 below, top seven countries from MENA with their ranks and export size with the years 2011-2016 in the value of thousands $.
Export of Turkey between 2011 and 2016 to top MENA countries.
| Rank | 2016 | 2015 | 2014 | 2013 | 2012 | 2011 | |
| Total | 142 529 584 | 143 838 871 | 157 610 158 | 151 802 637 | 152 461737 | 134 906 869 | |
| 3 | Iraq | 7 636 670 | 8 549 967 | 10 887 826 | 11 948 905 | 10 822 144 | 8 310 130 |
| 7 | UAE | 5 406 993 | 4 681 255 | 4 655 710 | 4 965 630 | 8 174 607 | 3 706 654 |
| 9 | Iran | 4 966 176 | 3 663 760 | 3 886 190 | 4 192 511 | 9 921 602 | 3 589 635 |
| 11 | Saudi Arabia | 3 172 081 | 3 472 514 | 3 047 134 | 3 191 482 | 3 676 612 | 2 763 476 |
| 12 | Israel | 2 955 545 | 2 698 139 | 2 950 902 | 2 649 663 | 2 329 531 | 2 391 148 |
| 13 | Egypt | 2 732 926 | 3 124 876 | 3 297 538 | 3 200 362 | 3 679 195 | 2 759 311 |
| 20 | Algeria | 1 736 371 | 1 825 875 | 2 078 889 | 2 002 689 | 1 813 037 | 1 470 547 |
Table 3. Source: Calculated values from TUIK (Note: value by thousands)
Besides, it can easily be said that MENA has been a good market for Turkey in terms of decreasing the trade balance deficit as well during the last decade as seen on table 4 below. As seen, it has been positive and increasing since 2007 to 2015.
Export and Import Volume with MENA and GDP of Turkey between 2007 and 2016
| Export to MENA | Import to MENA | Trade Balance with MENA | |
| 2007 | $19.111.005,00 | $12.434.494,00 | $6.676.511,00 |
| 2008 | $31.280.657,00 | $16.681.154,00 | $14.599.503,00 |
| 2009 | $26.608.583,00 | $9.371.678,00 | $17.236.905,00 |
| 2010 | $30.320.041,00 | $16.108.919,00 | $14.211.122,00 |
| 2011 | $34.635.577,00 | $23.781.467,00 | $10.854.110,00 |
| 2012 | $51.894.757,00 | $24.718.351,00 | $27.176.406,00 |
| 2013 | $45.616.410,00 | $25.722.530,00 | $19.893.880,00 |
| 2014 | $45.141.604,00 | $23.916.235,00 | $21.225.369,00 |
| 2015 | $39.612.882,00 | $16.581.595,00 | $23.031.287,00 |
| 2016 | $39.059.172,00 | $16.961.545,00 | $22.097.627,00 |
Table 4. Source: TUIK. (Turkish Statistical Institute) (Note: value by thousands)
All export share within the GDP accounts more than %20. MENA export share within GDP of Turkey has increased from %3 to 6,5% in the years between 2007 to 2012 and then fluctuated around %5 until 2017 as seen below table 4 (prepared by collected information gained from TUIK).
Export Volume with MENA and GDP of Turkey
| Year | Export to MENA | GDP | Export/GDP |
| 2007 | $19.111.005.000,00 | $648.754.000.000,00 | 2,95% |
| 2008 | $31.280.657.000,00 | $742.094.000.000,00 | 4,22% |
| 2009 | $26.608.583.000,00 | $616.703.000.000,00 | 4,31% |
| 2010 | $30.320.041.000,00 | $731.608.000.000,00 | 4,14% |
| 2011 | $34.635.577.000,00 | $773.980.000.000,00 | 4,47% |
| 2012 | $51.894.757.000,00 | $786.283.000.000,00 | 6,60% |
| 2013 | $45.616.410.000,00 | $823.044.000.000,00 | 5,54% |
| 2014 | $45.141.604.000,00 | $799.370.000.000,00 | 5,65% |
| 2015 | $39.612.882.000,00 | $861.467.000.000,00 | 4,60% |
| 2016 | $39.059.172.000,00 | $856.791.000.000,00 | 4,56% |
Table 5. Source: Calculated values from TUIK (Turkish Statistical Institute)
However, table 4 shows that export in Iraq, Egypt and Algeria have decreased while slowly increased or remained similar in other four countries. As known, there are political tensions between Turkish government and Egypt. After coup happened in Egypt in 2013, Turkish government has stood against the army rule and expressed itself in many official country basis speeches. Therefore, some restrictions on customs and inside the country on Turkish businessmen, products and investments such as in construction sectors have shown up. Therefore, these events might be possible reason of the outcomes in trade between Turkey and Egypt. Most importantly, Iraq is a leading importer country in MENA and there is almost %40 decrease in the size of export of Turkey between 2013 and 2016. Furthermore, Iraq is the most important export outlet in the MENA with its imports from Turkey. Iraq is the destination of %22 Turkish exports to the MENA in 2011 according to the TUIK. According to Barkey (2011) that Iraq imports a great variety of industrial products, ranging from steel to electrical devices and consumer durables. Also, many Turkish firms have engaged business in finance and construction sectors. For example, Turkish Airlines begun to direct flights to Erbil in 2011 and some Turkish banks opened branches in Iraq. On the other hand, since 2013 Turkish export to Iraq has decreased from $13M to $7,5M in 2016. Daesh seized the Mosul in 2013 and this situation led to a civil war in Northern Iraq. Also political tensions between Turkey and Iraq Kurdish regional government has been shuttling because of some reasons such as Kurdish question, Turkish military landing in Northern Iraq and lastly independence referendum in 2017. Therefore, Turkish export to Iraq have decreased since 2013 and difference between UAE has come to very similar while it was large in 2013 as seen on Table 3.
Turkish export is larger than its import with MENA countries even if its overall trade balance is negative. If Turkey increases its exporter position in this area, it will decrease its trade balance deficit. Turkey’s international trade balance with MENA as seen below table 6.
Table 6. Source: Calculated values from TUİK (Turkish Statistical Institute)
According to TUIK data (2017), Turkish export shares in the MENA countries out of the total Turkish export was %18 with 19 billion US dollars in 2007 and has been dramatically increased to %34 with 52 billion US dollars, almost doubled as share and tripled as amount in 5 years by 2012. (Table 7).
However, this export share suddenly decreased to %30 in 2013 and then remained similar as percentage around %27 with 45 billion us dollars but decreased in amount to 40 billion us dollars until the beginning of 2017. It can be seen that there is a huge development in international trade of Turkey with the MENA countries between 2007 and 2012, whereas it remained similar or even decreased in recent years as proportion of total international trade. On the other hand, import share of Turkey with the MENA countries has been slightly changed between 7% and %11 in the years between 2007 and 2017.
Comparison between Export Volume of Turkey with MENA and Total Export with the World between 2007 and 2016
| Export to MENA | Total Export of Turkey | The MENA Share in Total | |
| 2007 | $19.111.005,00 | $107.271.749,90 | 17,82% |
| 2008 | $31.280.657,00 | $132.027.195,63 | 23,69% |
| 2009 | $26.608.583,00 | $102.142.612,60 | 26,05% |
| 2010 | $30.320.041,00 | $113.883.219,18 | 26,62% |
| 2011 | $34.635.577,00 | $134.906.868,83 | 25,67% |
| 2012 | $51.894.757,00 | $152.461.736,56 | 34,04% |
| 2013 | $45.616.410,00 | $151.802.637,09 | 30,05% |
| 2014 | $45.141.604,00 | $157.610.157,69 | 28,64% |
| 2015 | $39.612.882,00 | $143.838.871,43 | 27,54% |
| 2016 | $39.059.172,00 | $142.529.583,81 | 27,40% |
Table 7. Source: Calculated values from TUİK (Turkish Statistical Institute)
Also, the MENA is an energy abundant region in terms of prosperous natural resources such as oil and natural gas. Oil reserves in the MENA accounts %53 natural gas reserves represent %43 of the total reserves in the world. [2] Turkey is also known as an energy dependent country so that it needs to import huge amount of energy such as natural gas, electric and oil, which its yearly spending has increased rapidly from 27 billion USD to around 54 billion USD between the years 2010 and 2017 and significantly from the MENA. Akyener (2017, Bloomberg) said that amount in terms of USD for energy import of Turkey within first six months has increased by %30 in 2017 compared to 2016. He also added that main reason of rising energy import invoice is the dramatic increases in the prices per barrel of oil. Şahin and Şahin (2014) indicate that oil prices have been increasing noticeably since Arab Springs started in 2010 and as a result of that changes in oil prices, many energy importer countries’ economy such as Turkey have been badly affected.
As a result, it is clearly seen from quantitative data that Turkey has strong economic ties with the MENA countries and recent developments in the MENA visibly have an influence on international trade of Turkey whereas recent developments have influenced Turkey’s export and import balance negatively within last five years although there is a significant development until the year 2012 and positive correlation until 2017 even it would be better.
3.2. Foreign Direct Investments
A developing country requires to increase its stock of capital in order to have an economic development. It may be possible by encouraging FDIs that occurs when foreign firms come to have manufacturing plants in domestic market or acquire ownerships of domestic firms. (Carbaugh, 2014).
Foreign direct investment plays an important role in the development of both developed and less developed economies alike. It contributes to the transfer of technology, stimulation of efficiency and rise in trade, which is a decisively beneficial to the host countries. Today, FDI is important for the developing countries like Turkey. (Mercül, 2015)
So does Turkey needs to be selective in allocating foreign direct investments and it used to be correctly. However, total FDIs accounts very small percentage of GDP in Turkey, which is only %1,4 according to World Bank data (2017). According to the data from Economy Ministry of Turkey retrieved from TCMB, most FDIs in Turkey have come from Europe that is around 65% of all FDIs and the rest belongs to America, Asia, Africa and others. (Table 8).
FDI shares of Turkey by Region
| REGION | 2016 FDI (MILLION DOLARS) | % SHARE | 2017/September FDI (MILLION DOLARS) | SHARE | |
| EUROPE | 4.867 | 66,1 | 3.971 | 77,9 | |
| EU COUNTRIES | 3.788 | 51,4 | 3.861 | 75,7 | |
| OTHER EUROPE | 1.079 | 14,7 | 110 | 2,2 | |
| AMERICA | 458 | 6,2 | 201 | 3,9 | |
| USA | 390 | 5,3 | 163 | 3,2 | |
| OTHER AMERICA COUNTRIES | 68 | 0,9 | 38 | 0,7 | |
| ASIA | 2.010 | 27,3 | 877 | 17,2 | |
| GULF COUNTRIES | 445 | 6,0 | 90 | 1,8 | |
| OTHER NEAR MIDDLE EAST COUNTRIES | 808 | 11,0 | 399 | 7,8 | |
| OTHER ASIA | 757 | 10,3 | 388 | 7,6 | |
| OTHER (AFRICA-OCENIA-AND OTHERS) | 29 | 0,4 | 49 | 1,0 | |
| TOTAL | 7.364 | 100,0 | 5.098 | 100,0 | 144.992 |
| REGION | 2002-2017/September
Total FDI (Million Dolars) |
% SHARE |
| EUROPE | 107.957 | 74,5 |
| EU COUNTRIES | 98.985 | 68 |
| OTHER EUROPE | 8.972 | 6 |
| AMERICA | 12.612 | 8,7 |
| USA | 11.361 | 8 |
| OTHER AMERICA COUNTRIES | 1.251 | 1 |
| ASIA | 23.753 | 16,4 |
| GULF COUNTRIES | 9.752 | 7 |
| OTHER NEAR MIDDLE EAST COUNTRIES | 7.355 | 5 |
| OTHER ASIA | 6.646 | 5 |
| OTHER (AFRICA-OCENIA-AND OTHERS) | 670 | 0,5 |
| TOTAL | 144.992 | 100,0 |
Table 8. Source:TCMB - Central Bank of Republic of Turkey
The five gulf countries are on the list of top 20 countries who invested in Turkey, which are respectively UAE, Saudi Arabia, Kuwait, Qatar, Lebanon. Ratios of those countries may give us a clue how the MENA FDIs in Turkey have been affected.
As seen on FDI statistics, amount of FDI from the MENA to Turkey has a downtrend. Also, real estate purchases and financial sector such as bank loans are main investment sector for Arab investors in Turkey. (Al-Monitor News Agency, 2017). Although there is no certain information why foreign investment from MENA decreased, recent issues mentioned in the second section in the MENA can be considered as an obstacle to their economic development, so that they would affect their investors in a negative way in Turkey.
According to the data from Economy Ministry of Turkey retrieved from TCMB, investments from the five Arab countries have sharply decreased, especially after the year 2013. (Table 8). For example, Qatar investment in Turkey was $469M in 2013 and it decreased to $350M in 2015 and slowly increased to $376M in 2016, whereas it has decreased to $62M as large amount in 2017 until September.
Despite there can be other reasons to explain why FDIs from Gulf countries to Turkey decreased. One of the main reasons for this sudden fall might be recent Qatar crisis in Gulf Cooperation Council. According to Economist News, Saudi Arabia, the UAE, Bahrain and Egypt closed their borders and cut diplomatic ties with Qatar in June 2017. Number of tourists from Gulf countries to Qatar decreased almost fifty percent. After the June, it fall almost by %70. Also, trade has fallen. But the boycott not only negatively affected Qatar, but also all Gulf countries. (2017). When those countries’ economies are hurt, it would affect their investors too.
Another point, UAE investment in Turkey also has been decreasing since 2013 respectively $176M, $115M, $80M, $36M and $21M in the year 2017. Also, Saudi investment was $439M in 2012 whereas it has not reached even to $100M in total since 2013. Some countries even stopped to invest. For example, Saudi Arabia has not invested yet in Turkey during the year 2017. Especially, what is seen that within last four years, there is a sharp and continuous decrease in amount of the MENA FDIs in Turkey. (Table 9).
Top 20 Inward FDI countries of Turkey between 2010 and 2017/September
| COUNTRIES | 2010 | 2011 | 2012 | 2013 | 2014 | |
| 1 | Netherlands | 486 | 1.424 | 1.381 | 918 | 2.022 |
| 2 | USA | 323 | 1.401 | 439 | 326 | 334 |
| 3 | Austria | 1.584 | 2.419 | 1.519 | 667 | 31 |
| 4 | England | 245 | 906 | 2.044 | 300 | 1.051 |
| 5 | Germany | 597 | 664 | 491 | 1.970 | 606 |
| 6 | Luxemburg | 311 | 562 | 1.186 | 278 | 565 |
| 7 | Spain | 205 | 2.251 | 193 | 506 | 74 |
| 8 | Belgium | 48 | 1.495 | 39 | 60 | 38 |
| 9 | France | 623 | 1.000 | 86 | 217 | 286 |
| 10 | Greece | 436 | 111 | 58 | 68 | 52 |
| 11 | Russia | 2 | 762 | 11 | 875 | 723 |
| 12 | Azerbaijan | 12 | 1.266 | 338 | 803 | 884 |
| 13 | United Arab Emirates | 104 | 89 | 52 | 176 | 115 |
| 14 | Italy | 25 | 111 | 154 | 148 | 488 |
| 15 | Switzerland | 123 | 233 | 454 | 204 | 149 |
| 16 | Japan | 347 | 231 | 106 | 439 | 257 |
| 17 | Saudi Arabia | 39 | 9 | 439 | 39 | 10 |
| 18 | Kuwait | 193 | 43 | 271 | 185 | 197 |
| 19 | Qatar | 52 | 50 | 46 | 469 | 8 |
| 20 | Lebanon | 29 | 45 | 315 | 573 | 35 |
Table 9. Source: TCMB - Central Bank of Republic of Turkey
Top 20 Inward FDI countries of Turkey between 2010 and 2017/September (cont’)
| COUNTRIES | 2015 | 2016 | 2017/September | 2002 - 2017/September Total | 2002 - 2017/September SHARE % | |
| 1 | Netherlands | 1.184 | 955 | 1.514 | 23.529 | 16,2% |
| 2 | USA | 1.619 | 390 | 163 | 11.361 | 7,8% |
| 3 | Austria | 80 | 361 | 310 | 10.064 | 6,9% |
| 4 | England | 585 | 950 | 124 | 9.662 | 6,7% |
| 5 | Germany | 355 | 437 | 217 | 9.074 | 6,3% |
| 6 | Luxemburg | 1.252 | 309 | 78 | 9.063 | 6,3% |
| 7 | Spain | 2.305 | 409 | 1.074 | 8.710 | 6,0% |
| 8 | Belgium | 767 | 23 | 217 | 8.426 | 5,8% |
| 9 | France | 164 | 88 | 89 | 6.939 | 4,8% |
| 10 | Greece | 48 | 36 | 27 | 6.894 | 4,8% |
| 11 | Russia | 747 | 723 | 0 | 5.646 | 3,9% |
| 12 | Azerbaijan | 839 | 652 | 397 | 5.296 | 3,7% |
| 13 | United Arab Emirates | 80 | 36 | 21 | 4.184 | 2,9% |
| 14 | Italy | 180 | 80 | 108 | 3.068 | 2,1% |
| 15 | Switzerland | 175 | 350 | 51 | 2.492 | 1,7% |
| 16 | Japan | 314 | 329 | 181 | 2.380 | 1,6% |
| 17 | Saudi Arabia | 17 | 11 | 0 | 1.949 | 1,3% |
| 18 | Kuwait | 7 | 22 | 7 | 1.586 | 1,1% |
| 19 | Qatar | 350 | 376 | 62 | 1.539 | 1,1% |
| 20 | Lebanon | 0 | 152 | 2 | 1.287 | 0,9% |
Table 9 (continue). Source: TCMB - Central Bank of Republic of Turkey
“Gulf Countries FDI between 2002 and 2016” (2016)
Table 10. Source: TCMB. retrieved from The Arab Gulf States Institution, 2016.
As oil prices fall in recent years, economies of the Gulf countries have been hurt because their economies are mostly dependent on petroleum sales to overseas. These states face the problem of foreign exchange deficits unlike past years. For example, Saudi Arabia had foreign exchange deficits of $53 billion 2015 and even Qatar ran $2 billion current account deficit. While UAE and Kuwait have current account surplus, their surplus has seen decline in a significant amount. This means Gulf Economies are no longer able to make foreign direct investment as much as they do in the past. (Al-Monitor News Agency, 2017). This information also gives a clear picture of gulf countries’ economy and may explain one side of how foreign investments from the MENA to Turkey have decreased in the recent years.
In short, even share of FDIs is not large in Turkish economy, it still represents important amount of cash flow and other benefits to the country. Although there is no existence of Arab springs or any regime changes in those five countries, FDIs has fallen. The fall in oil price, domestic politics crisis and Turkey-based concerns can be considered as the reasons why the foreign direct investments by the MENA decreased, especially top investor countries in the Gulf region.
In conclusion, international trade between countries plays an important role as the world economy is getting more globalized. Also, there are ups and downs in countries’ exports and imports. Case of the relationship between Turkey and the MENA countries have been analysed in the paper. Foreign economic policies of Turkey have led to an increase in its export and FDIs since 1980 when it begun to have more open to international trade. Especially in the MENA, after 2005, it enjoyed larger export volumes and share in GDP. Whereas, due to the issues in the MENA region after 2010s, that growth trend does not keep the same. Issues in MENA such as Arab springs, Iran boycott, newly established terror organizations, some political tensions with Turkey, Qatar crisis in GCC are main topics that explain best what is happening in the region. Iran has been facing sanctions by USA force, its economy does not develop as expected. Therefore, it affects its international trade, and trade with Turkey as well. It is important for Turkey too, because Iran is 3rd biggest trade partner of Turkey in the MENA region. Also, after Arab Springs, export of Turkey has fall trend in the 6 countries which are Tunisia, Egypt, Libya, Syria, Yemen and Bahrain although there was a considerably rise in the exportation. Similar trend also can be seen in FDIs of Gulf countries. Despite FDIs does not account much in Turkey’s economy, it is still important. Although there was no investment in Turkey in 2000s, Turkey has attracted investment in increasing trend by Gulf countries that are Bahrain, UAE, Qatar, Kuwait and Saudi Arabia between 2004-2012 compared to the past. But, there is no considerable growth in the FDIs of Gulf countries especially after 2014. Therefore, all in all, it could be pointed out that Turkey’s international trade on the MENA still has large volume, whereas it is clearly seen that Turkey has been slowly losing in its trade volume with the MENA countries since 2012.
Muhammed Enes USLU
References:
Barbieri, K., & Reuveny, R. (2005). Economic Globalization and Civil War. The Journal of Politics, 67(4), 1228-1247. Retrieved from http://ezproxy.sehir.edu.tr:5035/stable/3449903
Barkey, J. H., (2011). Turkey and Iraq: The making of Partnership. Vol. 12, No. 4, 663–674, December 2011. Retrieved from http://ezproxy.sehir.edu.tr/login?url=http://ezproxy.sehir.edu.tr:5007/login.aspx?direct=true&db=a9h&AN=69603986&site=eds-live
Bloomberg. (2017). Turkish energy import invoice raised. Retrieved from. http://www.bloomberght.com/haberler/haber/2037480-turkiye-nin-enerji-ithalati-faturasi-artti
BP, Statistical Review of world energy. (2017) Retrieved from https://www.bp.com/content/dam/bp/en/corporate/pdf/energy-economics/statistical-review-2017/bp-statistical-review-of-world-energy-2017-full-report.pdf
Carbaugh, R. J., International Economics, 15th edition. (2014).
Dinç D. T., Gökmen, A., Nakip, M. & Azari, N.M. (2017) The impact of foreign trade issues on economic growth in some developing countries including Iran and Turkey, Journal of Transnational Management, 22:3, 171-202, DOI: 10.1080/15475778.2017.1346455
Economist. (2017). https://www.economist.com/news/middle-east-and-africa/21730426-if-saudis-and-emiratis-will-not-trade-doha-iranians-will-boycott
FDI Statistics of Turkish Economy Ministry. (2017). Retrieved from https://www.ekonomi.gov.tr/portal/faces/home/yatirim/uluslararasiYatirim/uluslararasi-dogrudan-yatirim
Investment Support and Promotion Agency of Turkey. (2017). Foreign Trade Statistics. Retrieved from. http://www.invest.gov.tr/en-US/investmentguide/investorsguide/Pages/InternationalTrade.aspx
KPMG & TİM. (2016). Economic and commercial impact analysis of Iran After Embargo.http://www.tim.org.tr/files/downloads/Raporlar/Ambargo%20Sonrasi%20Iran%20Ekonomik%20Etki%20Analizi_web.pdf
Köse, T. (2014). Turkey's power in the Middle East and North Africa: an assessment of the potential and the limits of non-coercive power/Turkiye'nin Kuzey Afrika ve Ortadogu bolgesindeki gucu: zorlayici olmayan gucun imkan ve sinirlari. Uluslararasi Iliskiler / International Relations, (41), 29. Retrieved from http://eds.b.ebscohost.com/eds/detail/detail?vid=2&sid=b5abdc3b-4fe8-4705-8787-2b802fca4b60%40sessionmgr101&bdata=JnNpdGU9ZWRzLWxpdmU%3d#AN=edsgcl.380340837&db=edsgao
Litman, S. (1926). The Effects of the World War on Trade. The Annals of the American Academy of Political and Social Science,127, 23-29. Retrieved from http://www.jstor.org/stable/1015691
TUIK. (2017). Foreign Trade Statistics. Retrieved from. http://www.tuik.gov.tr/VeriBilgi.do?alt_id=1046
Turkish Ministry of Foreign Affairs. (2017). Middle East and North Africa. Retrieved from http://www.mfa.gov.tr/sub.tr.mfa?ff1be5b3-51d9-4c0a-99f5-291c33c39414
Hafizoglu, R. (2013, November 26). BRIEF: Ambassador: Sanctions against Iran negatively affect economic relations with Turkey. Trend News Agency. Retrieved from http://ezproxy.sehir.edu.tr:5063/eds/detail/detail?vid=2&sid=1a6f248e-5829-4df3-8157-8d2085ab3074@pdc-v-sessmgr01&bdata=JnNpdGU9ZWRzLWxpdmU=#AN=2W64013277146&db=n5h
Hough, P. (2010). In: World politics : international relations and globalisation in the 21st Century. International political economy I : theory & history. Pearson Longman, 320-359. Retrieved from http://eprints.mdx.ac.uk/9744/
Mercül, A. K. (2015). FOREIGN DIRECT INVESTMENT IN TURKEY IN THE FRAMEWORK OF CANDIDACY TO THE EU. Marmara Üniversitesi. EBSCOhost, ezproxy.sehir.edu.tr/login?url=http://search.ebscohost.com/login.aspx?direct=true&db=ir00559a&AN=tuda.article.1711&site=eds-live.
Sonmez, M. Al-Monitor News. Is gulf money a really lifesaver for Turkish Economy?. (2017). Retrieved from https://www.al-monitor.com/pulse/originals/2017/01/turkey-gulf-money-lifesaver-for-economy.html
Şahin, M , Şahin, Ö . (2014). THE EFFECTS OF THE ARAB SPRING ON TURKISH ECONOMY. Yönetim ve Ekonomi Araştırmaları Dergisi, 12 (23), 171-187. Retrieved from http://dergipark.gov.tr/yead/issue/21808/234420
US Department of Treasury. (2017). Iran Sanctions. Retrieved from https://www.treasury.gov/resource-center/sanctions/Programs/pages/iran.aspx
OPEC, share of world crude oil reserves. (2016). Retrieved from http://www.opec.org/opec_web/en/data_graphs/330.htm
Öncel, A., & Malik, A. (2015). The Arab Spring and its Impact on the Foreign Trade of Turkey. Bilgi, 17(2), 17-36.
ÖZDAMAR, Ö. T., HALİSTOPRAK, B. T., & SULA, İ. T. (2014). From good neighbor to model : Turkey's changing roles in the middle east in the aftermath of the arab spring. Uluslararası İlişkiler, 11(42), 93. Retrieved from http://ezproxy.sehir.edu.tr/login?url=http://ezproxy.sehir.edu.tr:5007/login.aspx?direct=true&db=uvt&AN=174676&site=eds-live
World Bank, Foreign Direct Investments net inflows % of GDP. Retrieved from https://data.worldbank.org/indicator/BX.KLT.DINV.WD.GD.ZS?name_desc=false
Table 8. The Arab Gulf States Institution. https://www.agsiw.org/wp-content/uploads/2017/12/Young_GCC-Turkey_ONLINE.pdf
[1] Investment Support and Promotion Agency of Turkey, (2017).
[2] Opec Data (2016) and as BP Petrol Data (2017).


Yorum Yaz